I turn raw, messy data into decisions that move the business.
Data Analyst based in Dubai specializing in Power BI, SQL, and Python. PL-300 certified, with hands-on experience processing 5M+ record datasets, building cloud ETL pipelines on AWS, and shipping dashboards that leadership actually uses.

Delivered
Analyzed
Tools
A glimpse of the work
9 dashboards · auto-rotating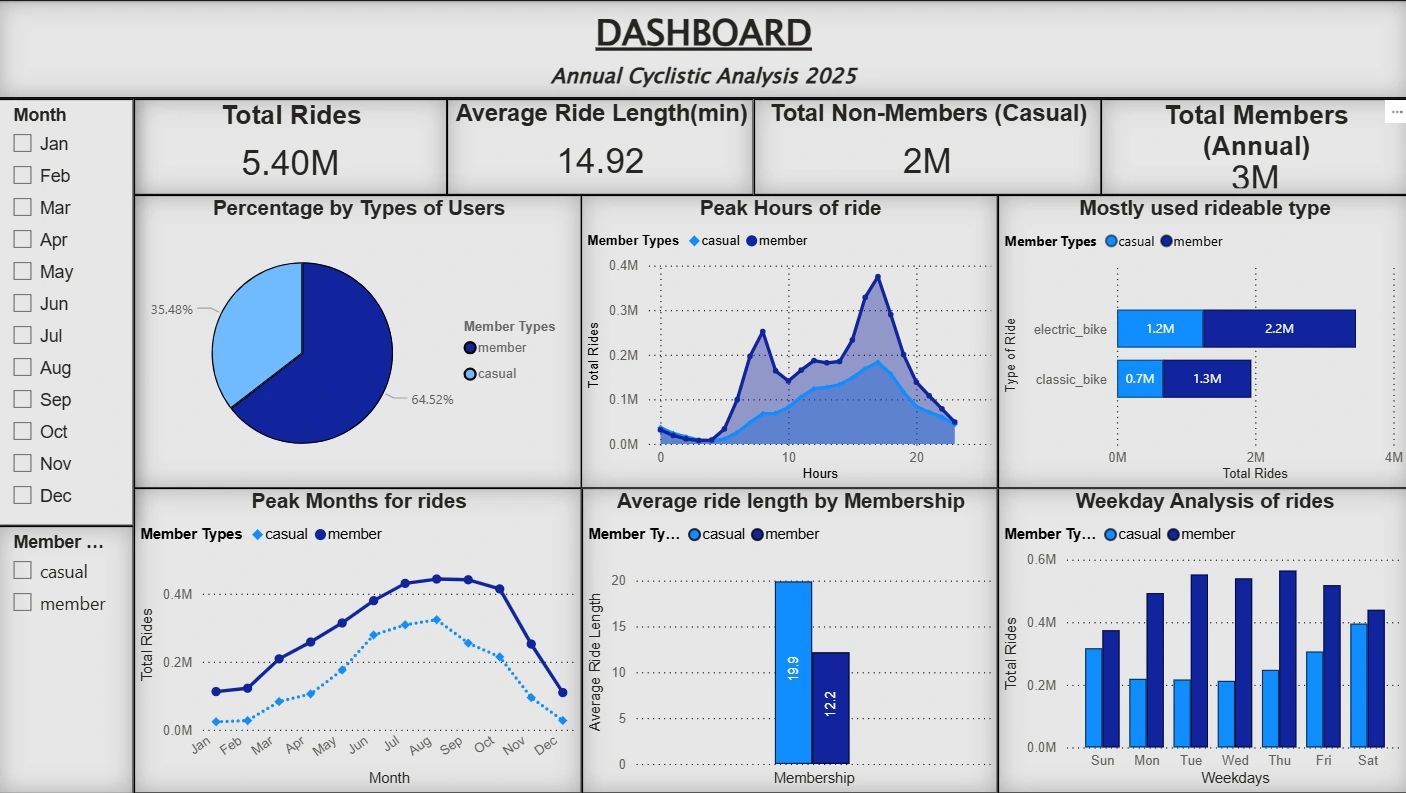
The person behind the dashboards.
Omer Ahmad Sayed
I graduated with a B.Tech in Computer Science & Engineering from AKTU in 2025, and moved into data analytics because I wanted my work to end somewhere concrete — a number, a dashboard, a decision someone actually made because of it. That's still what pulls me into every project.
My approach is simple: get the data model right before anything else. A clean, well-structured model makes every DAX measure, every SQL query, and every downstream chart easier and more trustworthy. I'd rather spend an extra hour on the foundation than patch a shaky report five times later.
I'm a current UAE resident (residence visa via parents' sponsorship), based in Dubai, and available to start immediately — no visa sponsorship or relocation timeline standing in the way.
Programming
- SQL
- Python (Pandas, NumPy)
Business Intelligence
- Power BI
- DAX
- Tableau
- Microsoft Excel
Databases & Cloud
- MySQL
- AWS S3 & Glue
- Amazon RDS
- Power BI Service
Concepts
- Data Visualization
- ETL & Data Transformation
- Exploratory Data Analysis (EDA)
- Statistical Analysis
- Data Modeling & KPI Analysis
Soft Skills
- Analytical & Critical Thinking
- Stakeholder Collaboration
- Communication & Presentation
- Attention to Detail
- Adaptability & Continuous Learning
Certifications
Selected projects.
Cyclistic Bike-Share Analysis
Segmenting 5M+ bike-share rides to convert casual riders into annual members.
Bellabeat Fitness Case Study
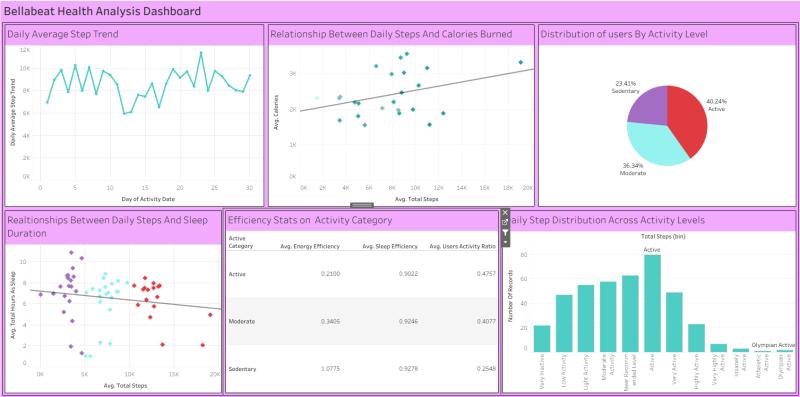
Analyzing 940K+ Fitbit records to uncover user activity and sleep behavior patterns.
COVID-19 Vaccination Analytics
Cloud ETL pipeline on AWS automating vaccination data reporting end-to-end.
Tailwind Traders: Executive Sales Dashboard
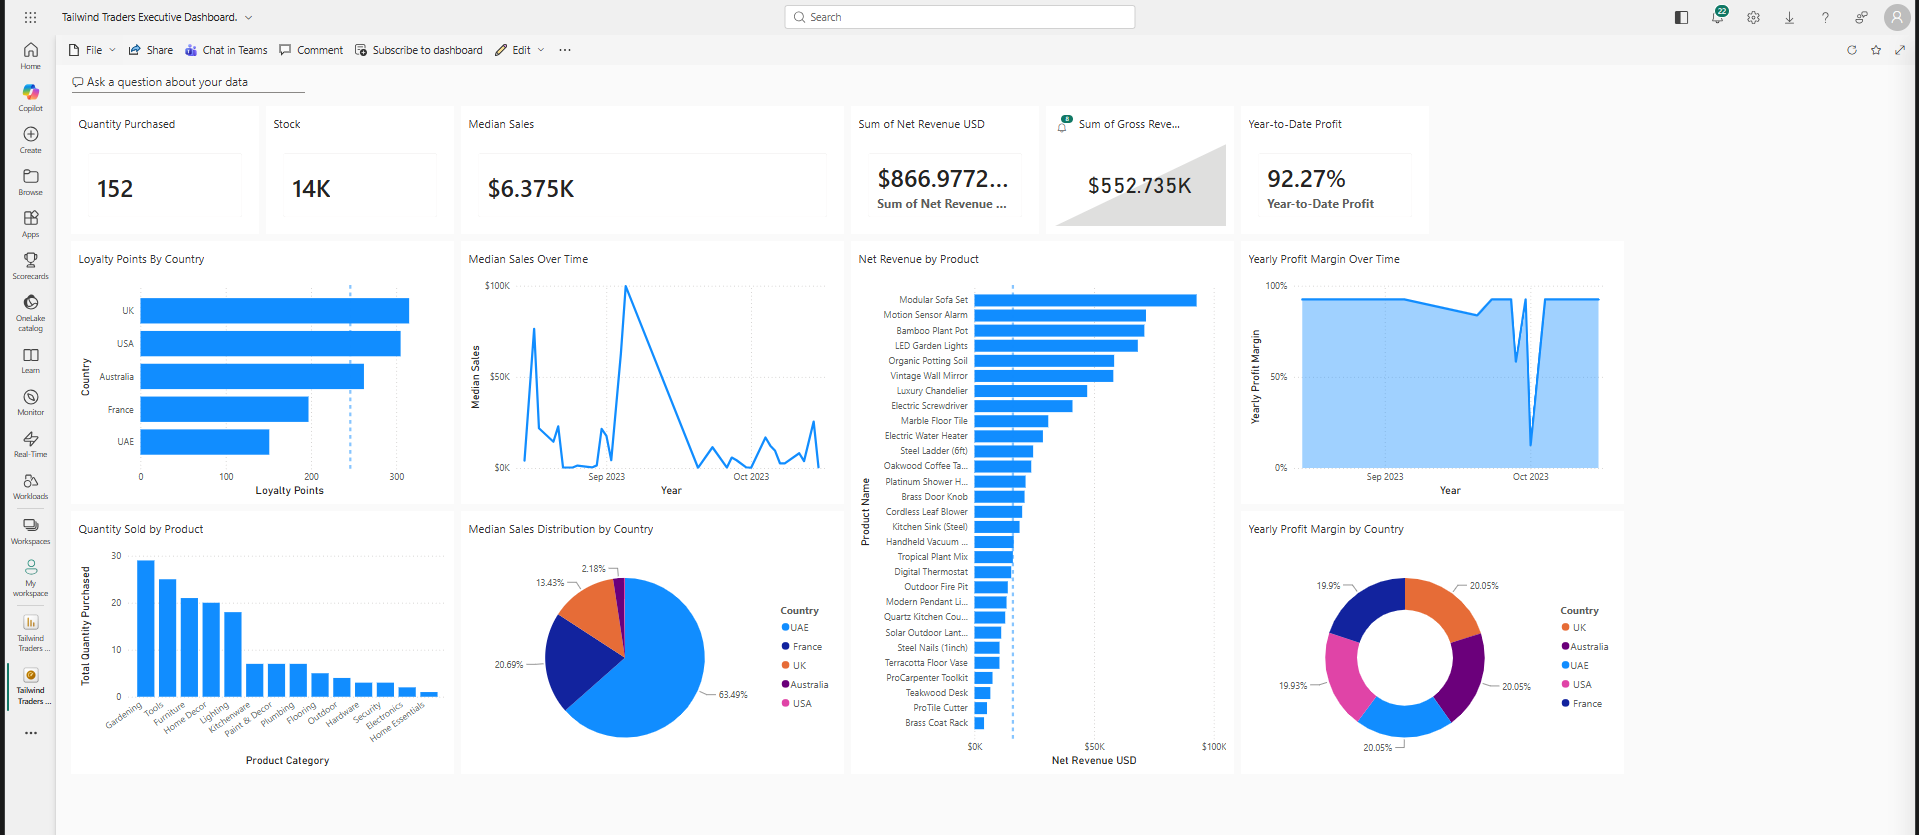
Multi-country executive dashboard tracking $866.97K in net revenue across regions.
Global Electronics Retailer Sales Report
Uncovering hidden profit drivers and a major delivery breakdown across a global retailer's product, store, and customer data.
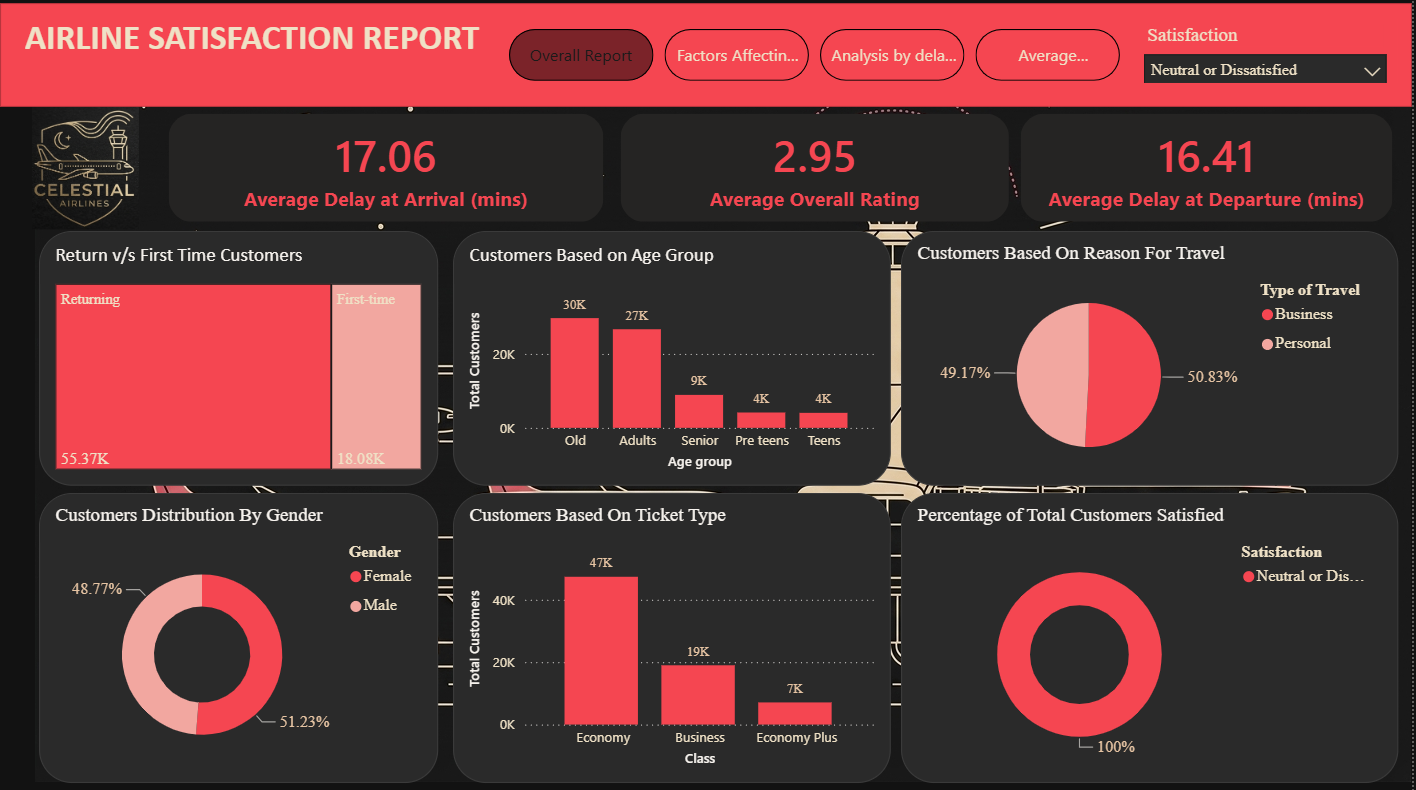
Celestial Airline Service Satisfaction
Diagnosing why 57% of airline customers are dissatisfied, and which services move the needle most.
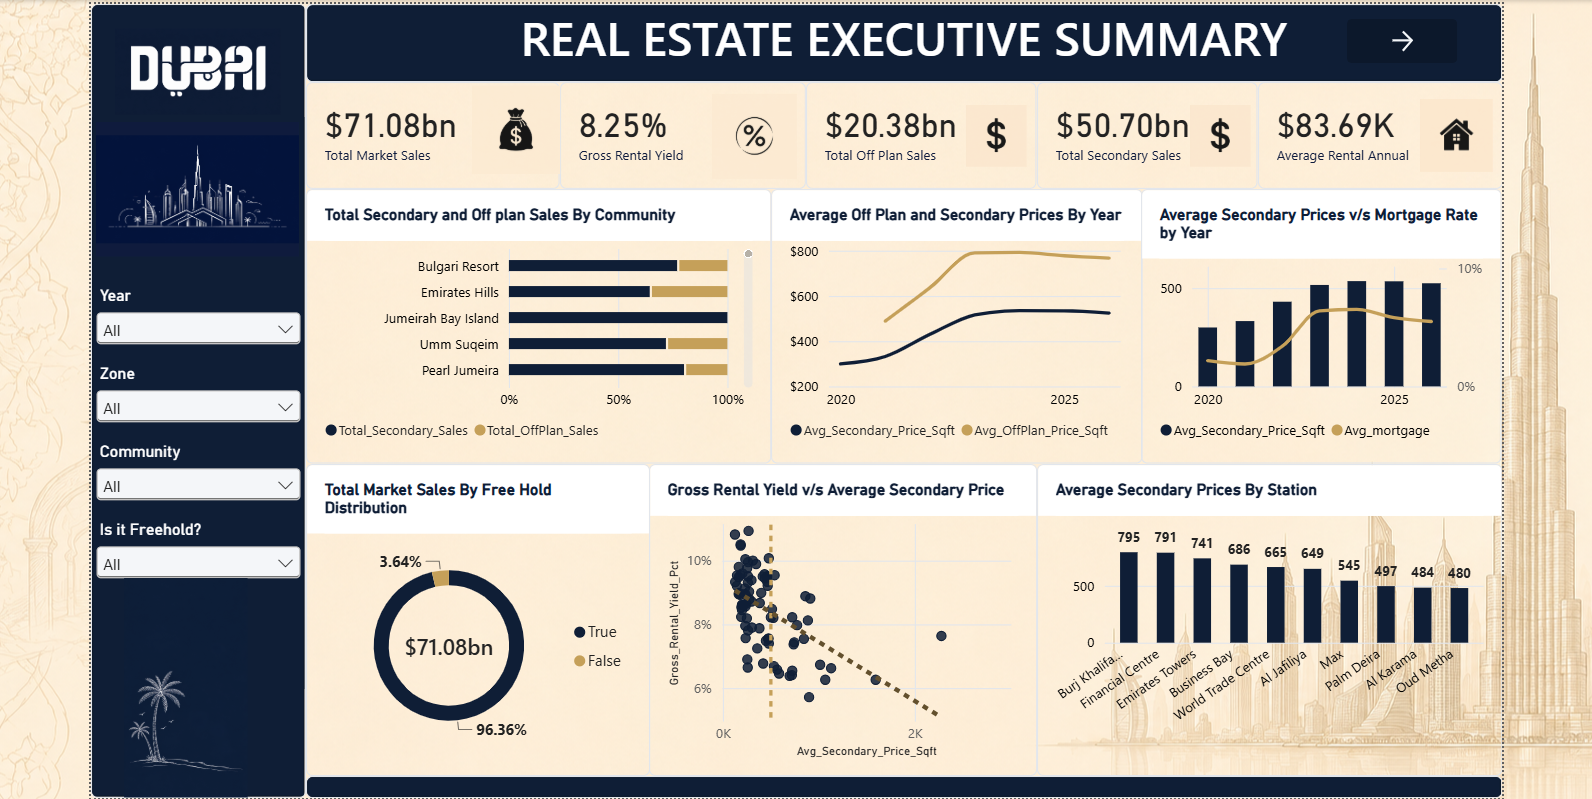
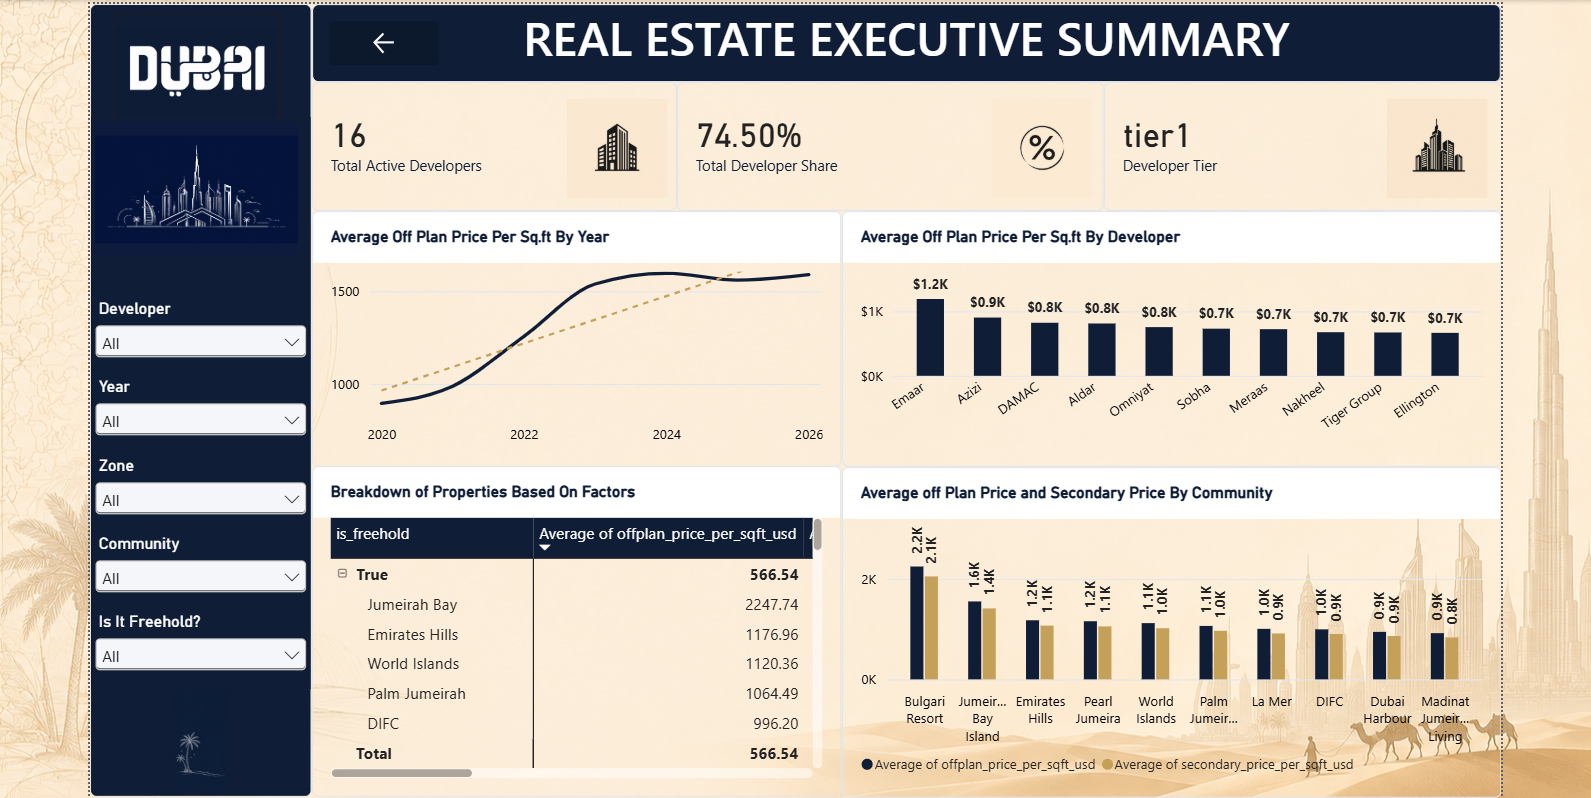
Dubai Real Estate: Executive Summary
Mapping $71bn+ in Dubai property activity to find where investors actually get the best yield.
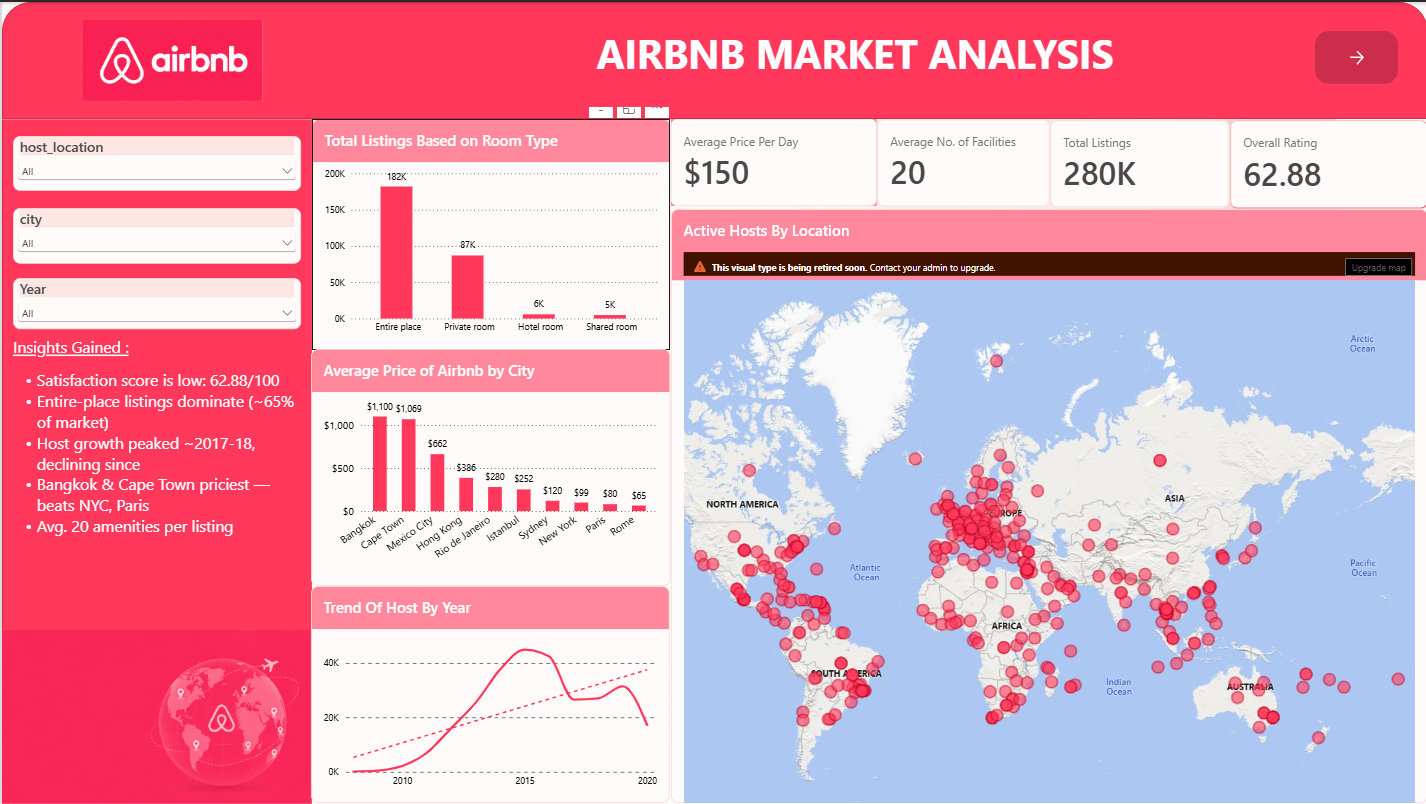
Airbnb Market Analysis
Cleaning 280K listings across 10 cities to find what really drives guest ratings and pricing.
Cyclistic Bike-Share Analysis
Turning ride-level data into a membership growth strategy.
The Business Problem
Cyclistic's marketing team needed to understand how casual riders differ from annual members, since converting casual riders into members was identified as the fastest path to future growth — but no one had modeled the behavioral gap between the two groups.
Technical Solution / Architecture
I processed and cleaned over 5 million individual ride records in R, standardizing timestamps, station data, and ride types across twelve months of raw CSV exports. I then built a star-schema data model in Power BI, connecting ride facts to date, station, and rider-type dimension tables, and layered on DAX measures for ride duration, frequency, and time-of-day segmentation.
Measurable Project Impact
- Casual riders rode 20–25% longer per trip than annual members, revealing a leisure-driven usage pattern distinct from commuter behavior.
- 60% of casual rides occurred on weekends, pinpointing exactly when and where to target conversion campaigns.
- Recommendations projected a 10–15% increase in membership revenue if acted on by the marketing team.
Bellabeat Fitness Case Study
Behavioral segmentation to sharpen a wellness marketing strategy.
The Business Problem
Bellabeat, a wellness-tech company, needed to understand how users actually engage with fitness tracking — activity, calories, and sleep — to make its wellness campaigns land with the right audience instead of a generic one-size-fits-all push.
Technical Solution / Architecture
I queried and cleaned 940,000+ Fitbit activity records in SQL, joining daily activity, hourly intensity, and sleep tables into a unified analysis base. I ran exploratory analysis in Excel to surface engagement and sleep-quality segments, then built Tableau dashboards to visualize the patterns for a non-technical marketing audience.
Measurable Project Impact
- Active users burned 30–40% more calories than the low-activity segment, confirming a clear high-value user group.
- 45% of users showed inconsistent activity and poor sleep, identifying a specific at-risk segment for targeted wellness content.
- Dashboards drove a 10–20% lift in user engagement when paired with targeted wellness initiatives.
COVID-19 Vaccination Analytics
A cloud ETL pipeline replacing manual reporting with real-time dashboards.
The Business Problem
Vaccination reporting was a manual, repetitive process — data had to be pulled, cleaned, and re-loaded by hand every reporting cycle, slowing down visibility into regional trends and key performance indicators.
Technical Solution / Architecture
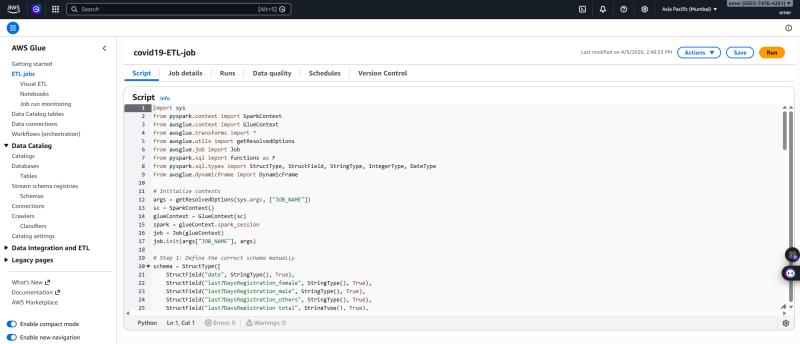
I designed a cloud-native pipeline using Amazon S3 as the raw data landing zone, AWS Glue for automated Python-based ETL transformation, PostgreSQL on Amazon RDS as the structured data store, and AWS QuickSight for the final reporting layer — removing every manual hand-off in the process.
Measurable Project Impact
- Cut manual processing time by 80% by fully automating extraction, transformation, and loading.
- Improved data accuracy by removing manual re-entry points from the reporting cycle.
- Delivered real-time QuickSight dashboards giving stakeholders live visibility into vaccination trends and regional KPIs.
Tailwind Traders: Executive Sales Dashboard
A single source of truth for leadership across every market.
The Business Problem
Tailwind Traders' leadership team was tracking sales performance across multiple countries through disconnected spreadsheets, making it slow and error-prone to compare revenue, margin, and growth trends across regions in one view.
Technical Solution / Architecture
I built the data model from raw transactional tables in Power Query, structured it for reliable multi-country roll-ups, and wrote DAX measures covering revenue, margin, and period-over-period growth. The final report was designed for an executive audience — every visual answers a specific leadership question at a glance.
Measurable Project Impact
- $866.97K in net revenue tracked and broken down across regions and product lines in a single dashboard.
- Replaced manual spreadsheet reporting with one live, leadership-ready view.
- Faster decision cycles for regional performance reviews, with drill-down from company-wide to country-level in a few clicks.
Global Electronics Retailer Sales Report
Finding the hidden profit drivers and the delivery breakdown no one had explained.
The Business Problem
Leadership needed to identify inefficiencies, hidden profit drivers, and operational gaps across products, stores, and customer behavior — including why high-revenue products weren't always the most profitable, and why delivery complaints kept piling up.
Technical Solution / Architecture
I built a star-schema model in Power BI with Sales as the fact table, a dedicated date table for consistent time intelligence, and exchange rates merged directly into Sales to standardize every figure in USD. Data was cleaned and validated in Excel and Power BI before modeling — nulls handled, duplicates removed, totals cross-checked against row counts.
Measurable Project Impact
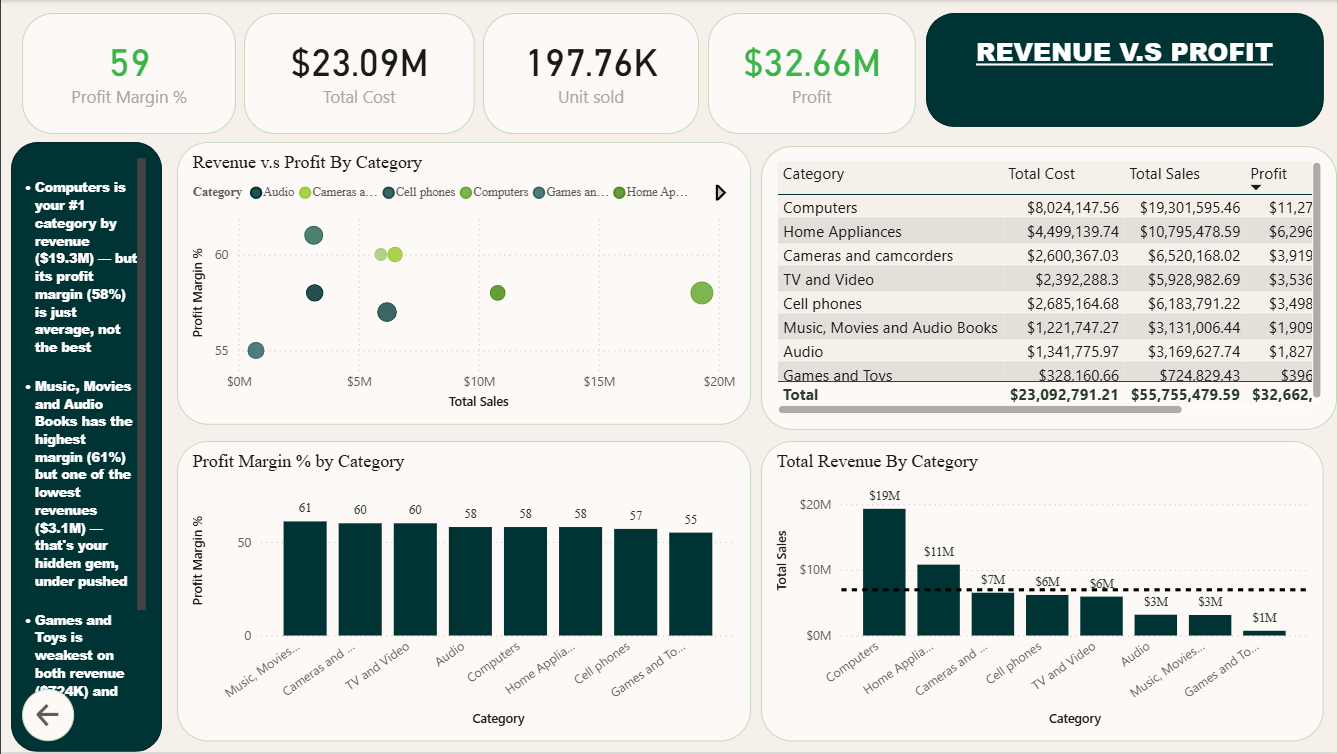
- $32.66M in total profit on $23.09M in total revenue — a 59% company-wide profit margin, with Computers driving $19.3M in revenue at a 58% margin.
- Identified a hidden margin opportunity: Music, Movies & Audio Books carried the highest margin (61%) despite the lowest revenue ($3.1M) — a clear category to push harder.
- Surfaced a data integrity issue: every country showed an identical store count of 67, flagging a likely broken relationship worth further investigation.
- Flagged a critical operations gap: ~79% of deliveries were logged as missing, only improving 11 points since 2016 — directly informing the recommendation for deeper delivery-data analysis.
Celestial Airline Service Satisfaction
Tracing a 57% dissatisfaction rate back to the services actually driving it.
The Business Problem
Celestial Airline was fielding a wave of service complaints and needed to know whether flight service quality was actually driving overall satisfaction — and if so, which specific service factors were the real bottlenecks.
Technical Solution / Architecture
Since the dataset arrived as a single wide table with 14 service-rating columns, I used a flat schema rather than forcing a star model that didn't fit the data. I cleaned and validated the full 129,881-row dataset in Power Query, standardized rating fields, and built calculated fields in Power BI to break satisfaction down by service category, delay time, distance, and traveler type.
Measurable Project Impact
- Overall satisfaction sat at just 3.24/5, dropping to 2.95 among the ~57% of customers who reported being dissatisfied.
- Pinpointed the weak spot: online services rated only 2.91 vs. 3.42 for physical products — directly identifying where to focus improvement first.
- Quantified the delay effect: satisfaction dropped as delays increased (avg. delay ~15 min), while longer flight distances correlated with higher satisfaction.
- Delivered a clear target: recommended lifting every service rating to 3.6+ to meaningfully shift the satisfied-customer share, plus a loyalty program for the largely returning, older, business-travel customer base.
Dubai Real Estate: Executive Summary
Turning $71bn+ in market activity into a single decision-support view for investors.
The Business Problem
Investors and stakeholders in Dubai's real estate market had no consolidated view connecting market-wide pricing trends, rental yield performance, and developer-level activity — making it hard to know where to confidently allocate capital across $71bn+ in tracked market activity.
Technical Solution / Architecture
I built a star schema around two shared dimensions — Community and Date — feeding four fact tables (off-plan, secondary sales, rentals, and monthly area prices), with a metro stations table for proximity data and a feature-engineering layer for calculated measures like average annual rent. Data was cleaned and validated in Excel and Power Query across all 93,439 rows before modeling.
Measurable Project Impact
- $71.08bn in total market sales consolidated into one view, with an 8.25% average gross rental yield and ~$84K average annual rental income.
- Uncovered the yield sweet spot: mid-tier properties under $1,000/sqft yield 8–12%, while premium properties near $2,000/sqft yield closer to 7% — favoring mid-tier over luxury for income investors.
- Quantified market concentration: Emaar holds a 74.5% developer share at $1.2K/sqft, roughly 30% above the next tier of developers.
- Delivered a clear recommendation: investors prioritizing yield over prestige should target mid-priced secondary properties in high-volume communities rather than premium off-plan developments.
Airbnb Market Analysis
Cleaning 280K listings across 10 cities in MySQL, then finding what really drives guest satisfaction.
The Business Problem
With an overall satisfaction score of just 62.88/100, Airbnb needed to understand what actually drives guest ratings and how pricing, room type and amenities affect them. The raw listings data across 10 cities was messy, with nulls, blanks and inconsistent host-location entries, so it had to be cleaned before any analysis could be trusted.
Technical Solution / Architecture
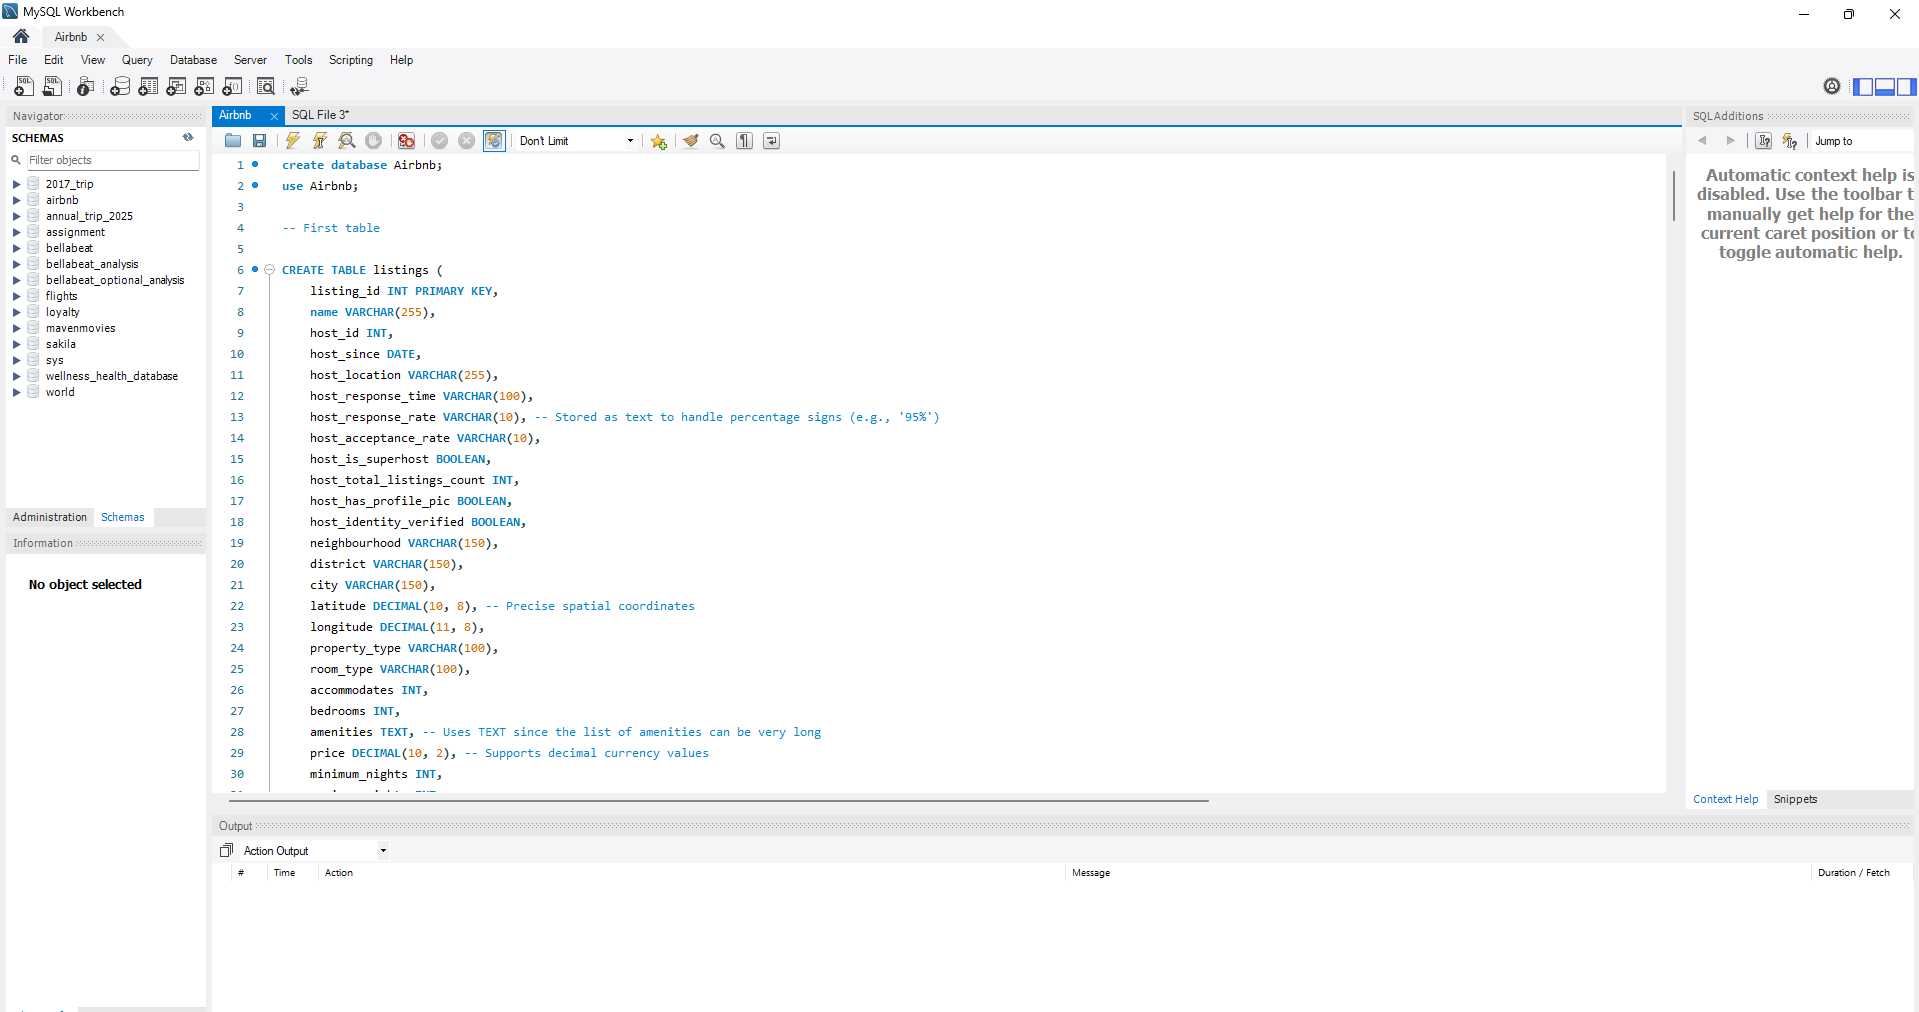
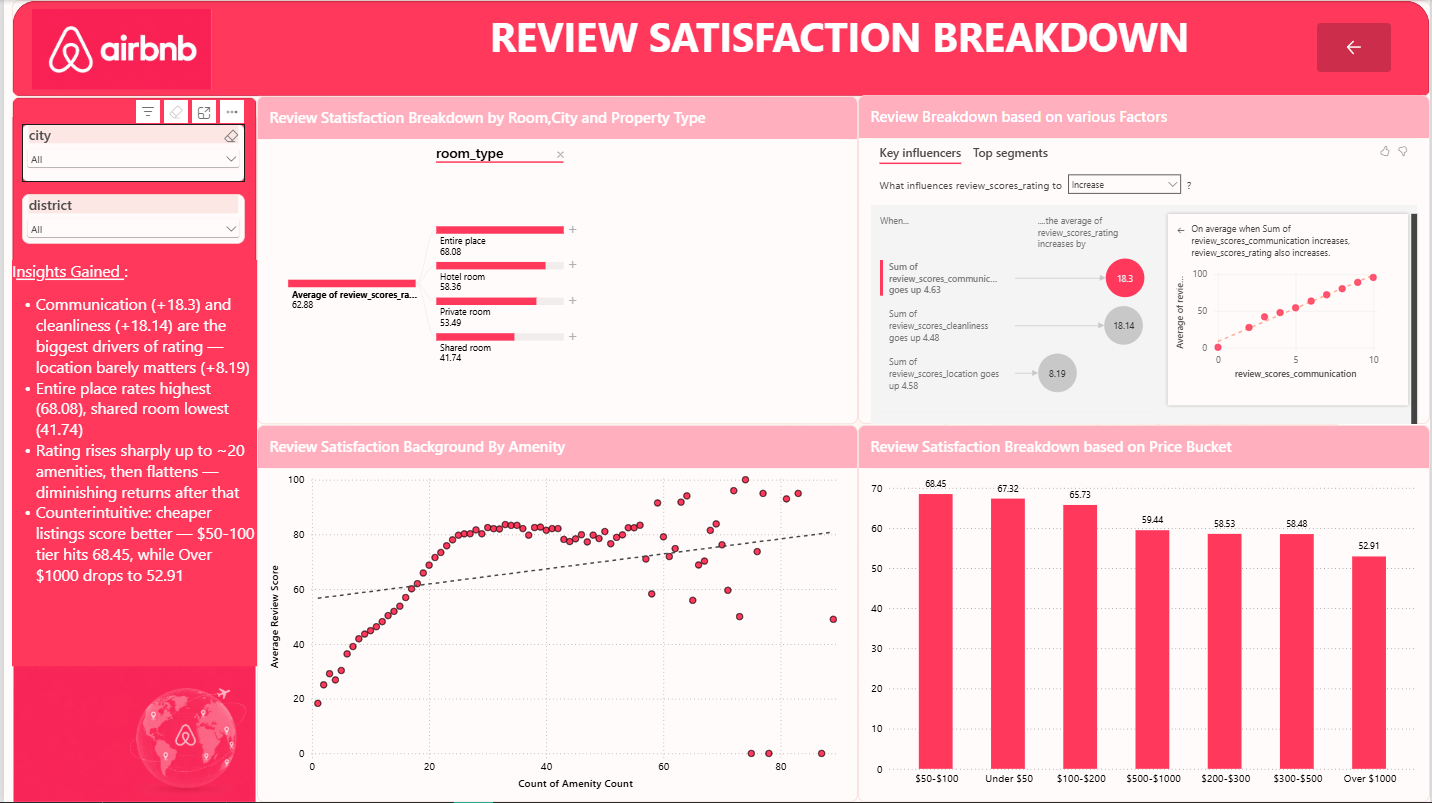
I loaded the listings into MySQL and removed the 4 rows with null values, confirmed there were no duplicate listing IDs, and took a backup table before making changes. Blank values were converted to proper nulls or "Not provided", and 180+ messy host-location values (country codes, city names, junk text) were standardised into country names. Unused columns were dropped and an amenity-count column was engineered from the amenities list. The cleaned data was then modeled in Power BI with DAX measures, using a Key Influencers visual, a decomposition tree and price-bucket analysis.
Measurable Project Impact
- 280K listings cleaned and made analysis-ready, with an average price of $150/day and about 20 amenities per listing.
- Rating drivers found: communication (+18.3) and cleanliness (+18.14) are the biggest drivers of guest rating; location matters far less (+8.19).
- Cheaper listings score better: the $50–100 tier averages 68.45, while listings over $1,000 drop to 52.91.
- Market structure: entire-place listings make up about 65% of the market (182K) and rate highest (68.08); shared rooms rate lowest (41.74).
- Priciest cities: Bangkok ($1,100) and Cape Town ($1,069) average more than New York or Paris, and ratings rise sharply up to about 20 amenities before flattening.
Where I've worked.
Operational Strategy & People Analytics Extern
Extern (Amazon-sponsored externship) · Remote
- Researched Amazon Fulfillment Center roles and wrote a one-page briefing note framing employee attrition as an operational risk, with root causes and next steps for leadership.
- Collected and reviewed employee feedback from Glassdoor and YouTube to find turnover drivers, identifying management issues as a key cause.
- Cleaned and organised the employee review data using Python (Pandas) in Google Colab.
Certifications.
Power BI Data Analyst Associate
Data Analytics Professional Certificate
Data Analytics Course
Power BI Data Analyst
Data Analyst Certification
Microsoft Certified: Power BI Data Analyst Associate

Google Data Analytics Professional Certificate


Microsoft Power BI Data Analyst

Data Analyst — Professional Certification

Full resume, one click away.
Let's talk data.
Open to Data Analyst and BI Analyst roles across the UAE. I reply within a day — usually faster.